
Finding the right business intelligence tool for modern companies can take time and effort, especially since most tools have the same standard features. Microsoft Power BI is one of the most popular tools for business intelligence that provides data analytics and interactive visualizations for various data types. You also can easily connect your PPM systems, such as Project Online, Planner, and Project for the Web, to Power BI.
Let’s consider the connection between Microsoft Planner and Power BI to get robust data analytics capabilities to transform raw data into interactive visual experiences.
Microsoft Planner Overview
Many companies are turning to Microsoft Planner to organize their work into projects and tasks, which can then be assigned to team members with deadlines.
Employees know when to act on their tasks, the next step in the project, and, most importantly, when it’s complete.
Because Microsoft Planner integrates with Office 365, it also means that you have access to all the files associated with the task right inside your plan.
Using Microsoft Planner to set up and manage tasks and project schedules, you can share statuses and progress with the rest of your organization.
If you are using Office 365 Groups to assign tasks, you can display your plan in the Groups section of Outlook so all team members can view the same information.
Connecting Planner to Power BI
Power BI is a comprehensive and robust business intelligence system created by Microsoft that helps business users with little or no experience in software development build insightful dashboards and get the most out of enterprise data.
Power BI can help project managers see the bigger picture and track projects more effectively. Moving away from manual reporting means they can spend more time with their teams.
There isn’t any standard way to connect Microsoft Planner to Power BI; however, FluentPro team can help establish the connection. It enables the creation of real-time reports and dashboards on task progress, resource utilization, and assignment details, among many others. By scheduling updates or refreshing on demand, you can ensure that your research accurately reflects Microsoft Planner data in real-time while keeping track of it through dashboards.
Get help with connecting Planner to Power BI from professionals
Learn moreThere are two ways to use Power BI to generate reports:
- Create reports using the Microsoft Power BI Service, which is a fully featured service (it can be integrated with other information sources as well)
- Use Power BI Desktop and build your custom reports with it
Report editors in Power BI and Power BI Desktop are similar. You can begin creating reports on the Power BI Desktop. They are then published to the Power BI service, where you can continue to edit them. Microsoft Power BI also enables you to make Microsoft Planner dashboard based on reports. You can distribute dashboards and reports between users. Depending on what access rights are granted to users, these resources can be used in the Power BI service in reading mode but not editing.
Get help with Power BI Planner Reports
Microsoft Planner reporting with Power BI can be a challenging task. Organizations may experience limited capabilities, low data visibility, complex processes of creating reports, poor data analytics, etc. That’s where Power BI professionals come in to help.
FluentPro Power BI Reporting Pack for Microsoft Planner
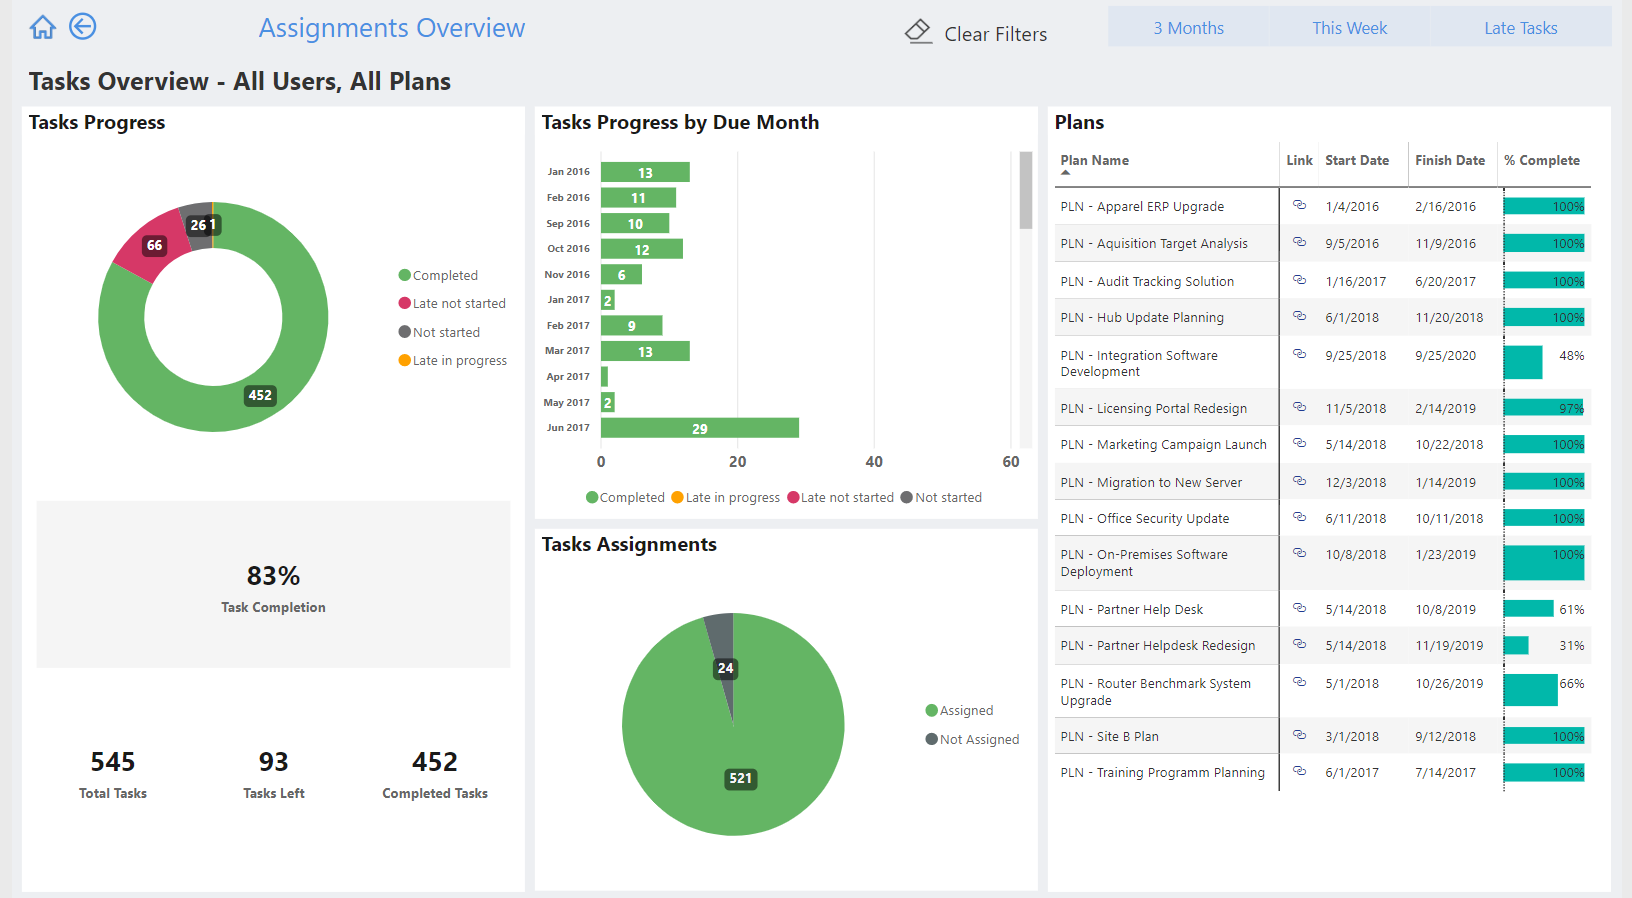
Power BI Reporting Pack for Microsoft Planner provides over 25 pre-built reports and dashboards on plan progress, task management, timelines, etc. These reports give project decision-makers access to the data, Microsoft Planner analytics, and insights they need. By revealing the “big picture” of task and resource data, users can examine workload and progress from various perspectives and make data-driven project decisions. This productivity-boosting solution was created to meet the needs of project managers, company leaders, decision-makers, and program directors.
Power BI consulting team can provide organizations with the following:
- Power BI Planner dashboard development. Our consulting team can design dashboards of any complexity.
- Customizable Power BI Planner reports. If you have business requirements or need to construct a new dashboard, these can be done quickly and with minimal effort.
- Enhanced visualization of portfolio data.
- Real-time project data visibility. With regular synchronization, Microsoft Planner reports can be updated, allowing project managers to access real-time project data insights.
- Advanced Microsoft Planner analytics.
Benefits of using Power BI and Planner
Using FluentPro Power BI Reporting Packs for Microsoft Planner can simplify reporting on project data. The following bullet points summarize exceptional value:
- Saved time on MS Planner reporting. Organizations get ready-made reports on various project levels.
- Advanced capabilities. Reports and dashboards can be customized anytime with the help of the Power BI consulting team.
- Visibility and the “Big Picture”. The solution provides high-level transparency and the capacity to visualize tasks, plans, and resources in the context of a larger picture.
- Greater Cooperation. A better foundation for collaboration between managers and employees, so both parties are constantly in sync.
- Enhanced decision-making. Advanced analytics and detailed reports facilitate data-driven decisions.
- Full support in Power BI and Planner usage. Power BI consulting team guides the creation and customization of dashboards and reports.
Contact us today
to reap the benefits of Microsoft Planner reporting with Power BI