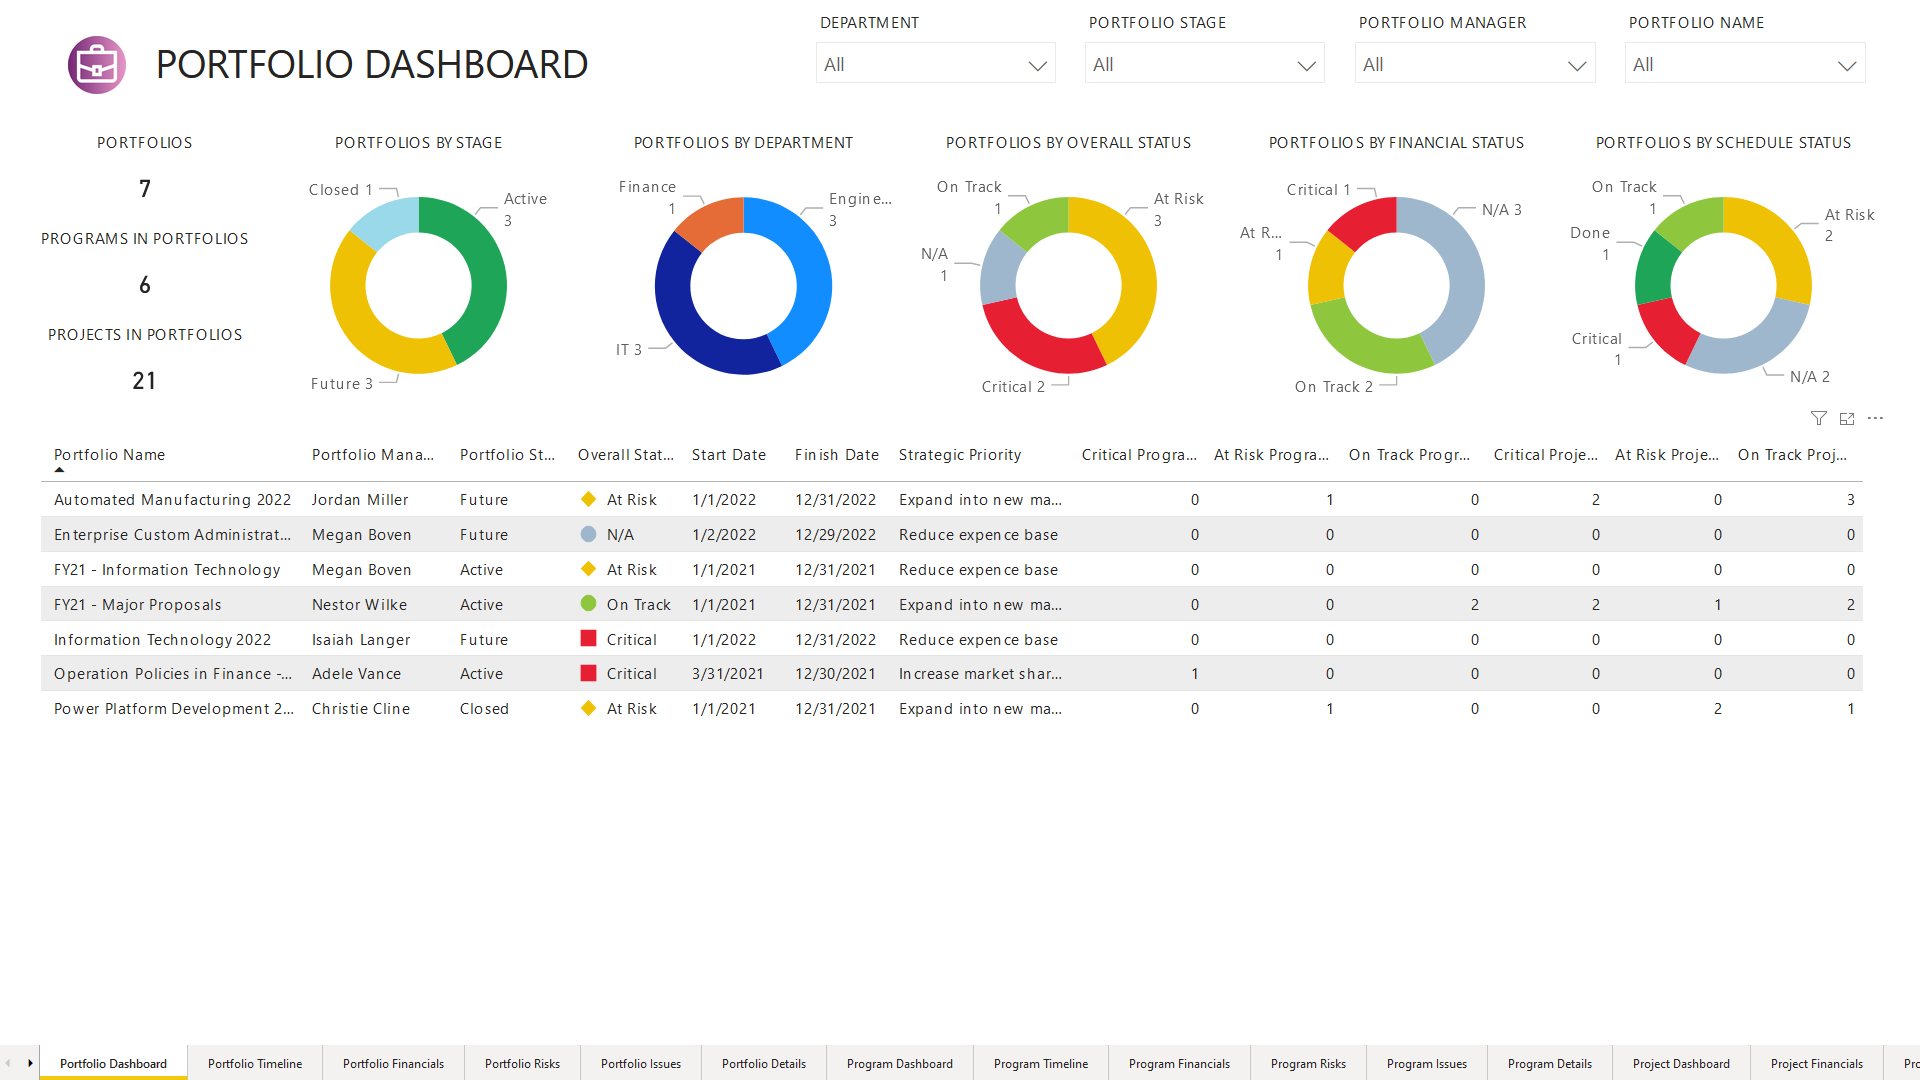
A Power BI custom report offers a cross-functional glance at a dataset, with visuals representing various findings and insights. Reports in Power BI may include a single graphic or several page visuals.
This article is solely written for project managers to explain how Power BI reports can help them connect multiple data sources into one page. As a result, they can help their teams get the most out of Power BI data visualization.
Advantages of Power BI Reporting
Reports in Power BI are created on a single data set, with graphics to express essential bits of information. Moreover, the graphics in the reports are dynamic and are updated whenever the underlying data changes.
You can interact with the graphics and filters as you explore the data to seek insights and solutions. Besides, a report is highly customizable, but the extent of customizability depends on the role and permissions the report creator provides.
How To Build a Report in Power BI
Power BI’s drag-and-drop canvas helps you quickly tell your story through data visualization. You can design your visuals from scratch with the open-source Power BI custom visuals framework. Let us look at the steps you must follow to create Power BI reports.
- Step 1: Choose a data source.
- Step 2: Create your report.
- Step 3: Upload your report to the report server.
Choose A Data Source
You can link to a single or several data sources. After choosing them, select the report server where you want to keep your reports.
Create Your Power BI Custom Report
You can quickly generate Power BI data-driven reports that also provide dynamic views. Power BI Desktop also includes more sophisticated functions:
- construct complex searches
- combine data from many sources
- create relationships between tables
Power BI Desktop offers a Report view allowing you to build an unlimited number of report pages with Power BI visualizations. You may reposition visualizations, copy & paste, merge them, and many more.
- When you initially load data into Power BI Desktop, you’ll see a starting point in the Report view, along with buttons to enable you to add data to the report.
- You can shift between report, data, and model views by choosing the icons in the left-hand navigation pane.
- After you’ve entered some data, you may add fields to a new canvas layout.
- You can also alter the visualization by selecting it on the canvas and selecting a new type under Visualizations.
You can analyze your data and work with your queries to ensure that your data delivers the most refined insights in your reports. After that, you can save your Power BI Desktop file wherever you choose.
Upload Report to The Server
When your report is finished, save it to the Power BI Report Server that you specified.
Copy and Paste Reports
You can effortlessly copy and paste a graphic from one Power BI Desktop report into another. You can copy the visuals on a page, then paste them into the target Power BI Desktop report.
Hide Reports
You may conceal pages from a report when you produce it. This method may be handy if you need to build underlying data or graphics in a report but don’t want others to access those pages.
FluentPro Power BI Consulting
We recommend consulting a professional if you’re still struggling with Power BI’s functions. FluentPro Power BI consulting team has over ten years of experience and is always available to assist you in creating custom data-driven reports.

FluentPro helps with:
- BI strategy development and business analysis
- data sources integration
- data modeling
- building customizable reports and dashboards
- immediate reporting according to changing data
Many companies struggle with the adoption and implementation of Microsoft BI technologies. As a result, they fail to make the most out of the Power BI platform. They also struggle with producing business value using data analytics and visualization. Moreover, gathering data from several sources into a single database is difficult. Companies can solve all these problems with Power BI consulting team.
By getting help from our team, your organization will benefit significantly:
- Tailor-made advanced reports customization
- Ready-made BI strategy meeting your business goals
- Informative insights for enhanced decision-making
- Deeper data analytics
Conclusion
Power BI reporting provides advanced data analytics and an informed decision-making process. To get reports fully customized to your business goals, you can permanently save time and effort by getting professional assistance from FluentPro.
Schedule a free consultation
with the FluentPro Power BI consulting team today


