According to a GlobeNewswire survey, the global business intelligence market is anticipated to reach $33.3 billion by 2025. This market’s tremendous growth clearly shows how vital data has become in business today. As the global business intelligence market continues to grow, so does the importance of business intelligence (BI) systems. That’s where Microsoft’s robust business analytics tool, Power BI, can play a significant role. Read the article to learn more about Power BI Microsoft Project Online reporting.
What is Power BI?
Power BI is a set of apps, connectors, and software services that combine forces to turn unrefined data into logical, well-structured, interactive insights and visually immersive dashboards. It makes visualizing and connecting with your data more accessible and helps produce the exact results you want. Power BI has been taking over the business analytics sector day by day.
Microsoft Power BI lets you model and visualize your data while providing fast AI-powered answers to your business questions. It’s easy to use and helps you gain deeper insight into your business.
Why should you use Power BI
Let’s review why organizations choose Power BI to meet their business intelligence (BI) needs.
- Easy Connection to Data Sources. Power BI supports more than 70 connectors that can extract data from Google Analytics, CSV, Excel, SQL databases, Dropbox, and other sources.
- Custom Visualization. Power BI has several pre-designed data visualizations that you can use to build interactive reports. You can also use services like FluentPro that offer Microsoft Power BI report packs for faster intelligence and analytics reports.
- High-Performance Rate. Power BI data modeling engine is a columnar database that can shrink original data sets from 1 GB to 200 MB, significantly improving performance.
15 Power BI Microsoft Project Examples for Practice
You can create reports and dashboards for your specific needs using a Power BI project template. Let’s look at some of the best Power BI project examples and ideas for practice.
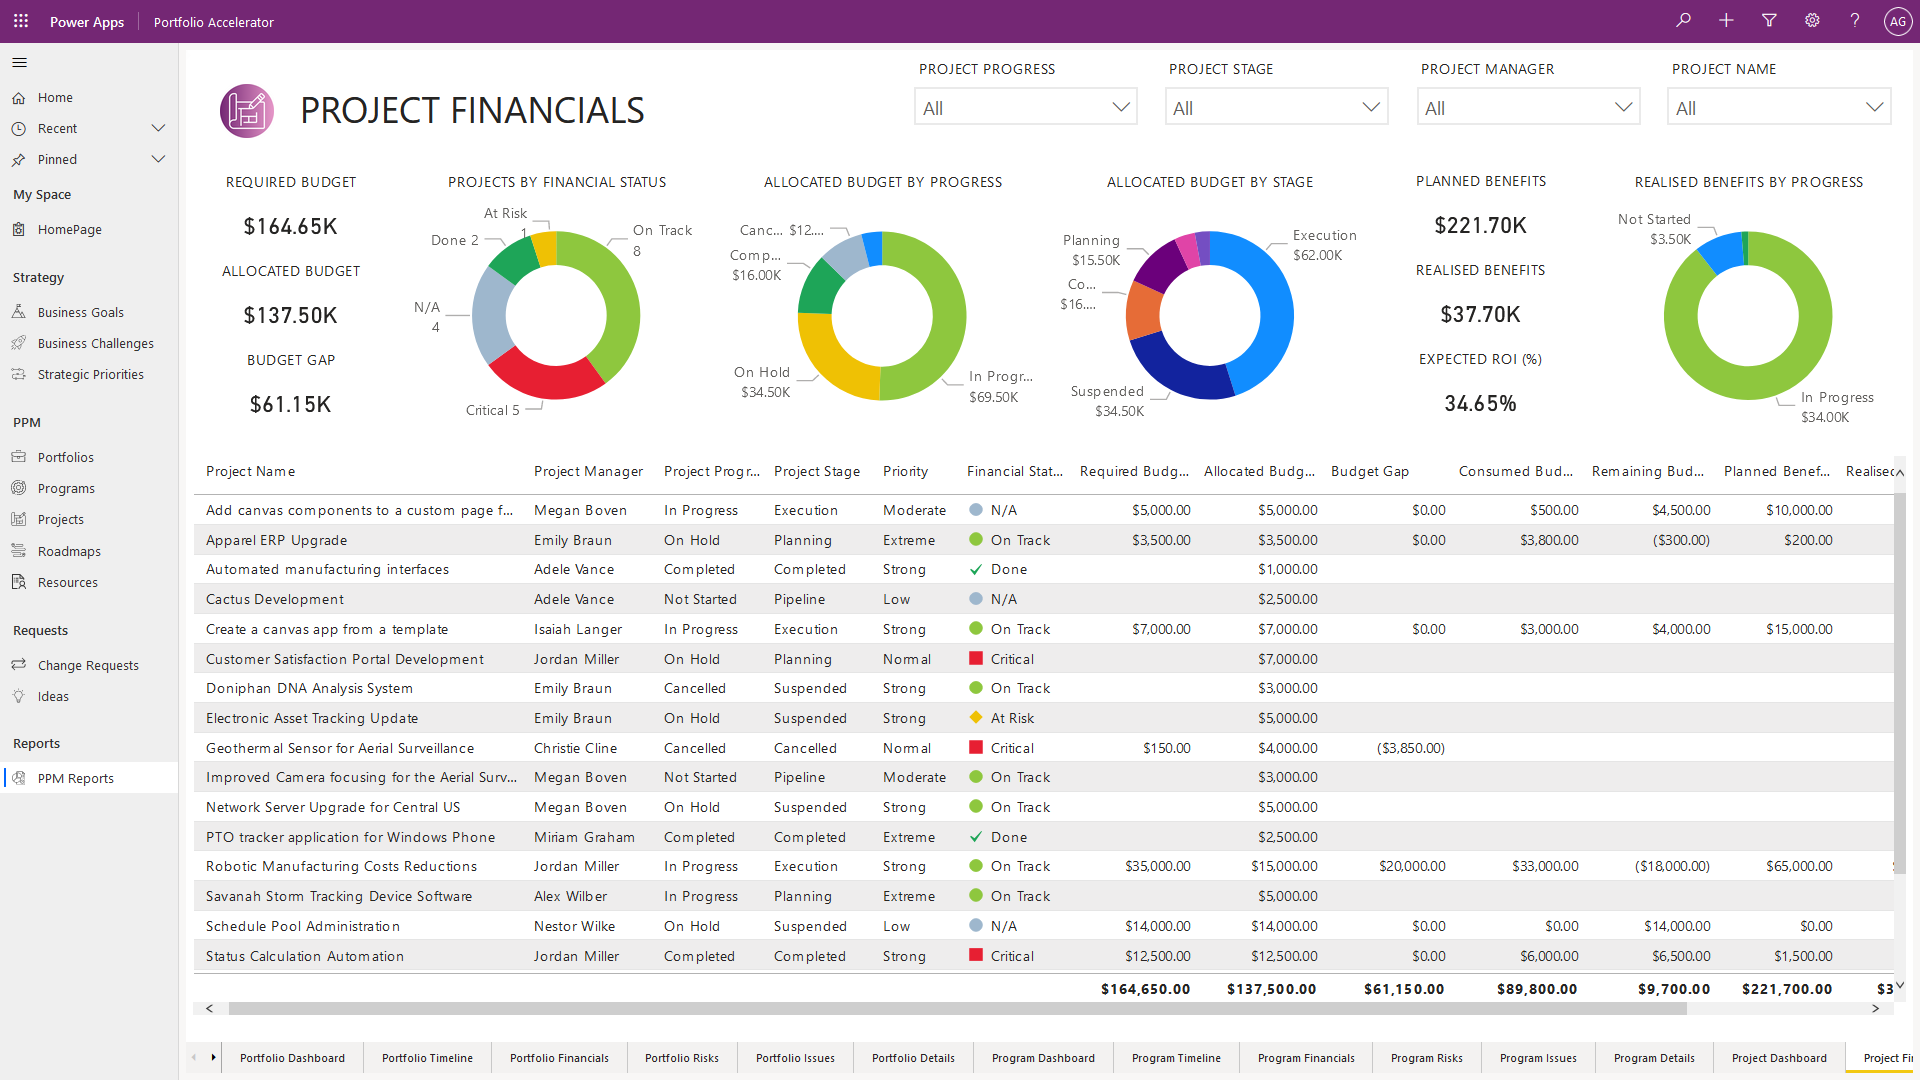
Financial Performance Analysis
This Microsoft Power BI project aims to improve financial reporting for any business offering accounting services to customers who require timely and accessible delivery of crucial financial reports.
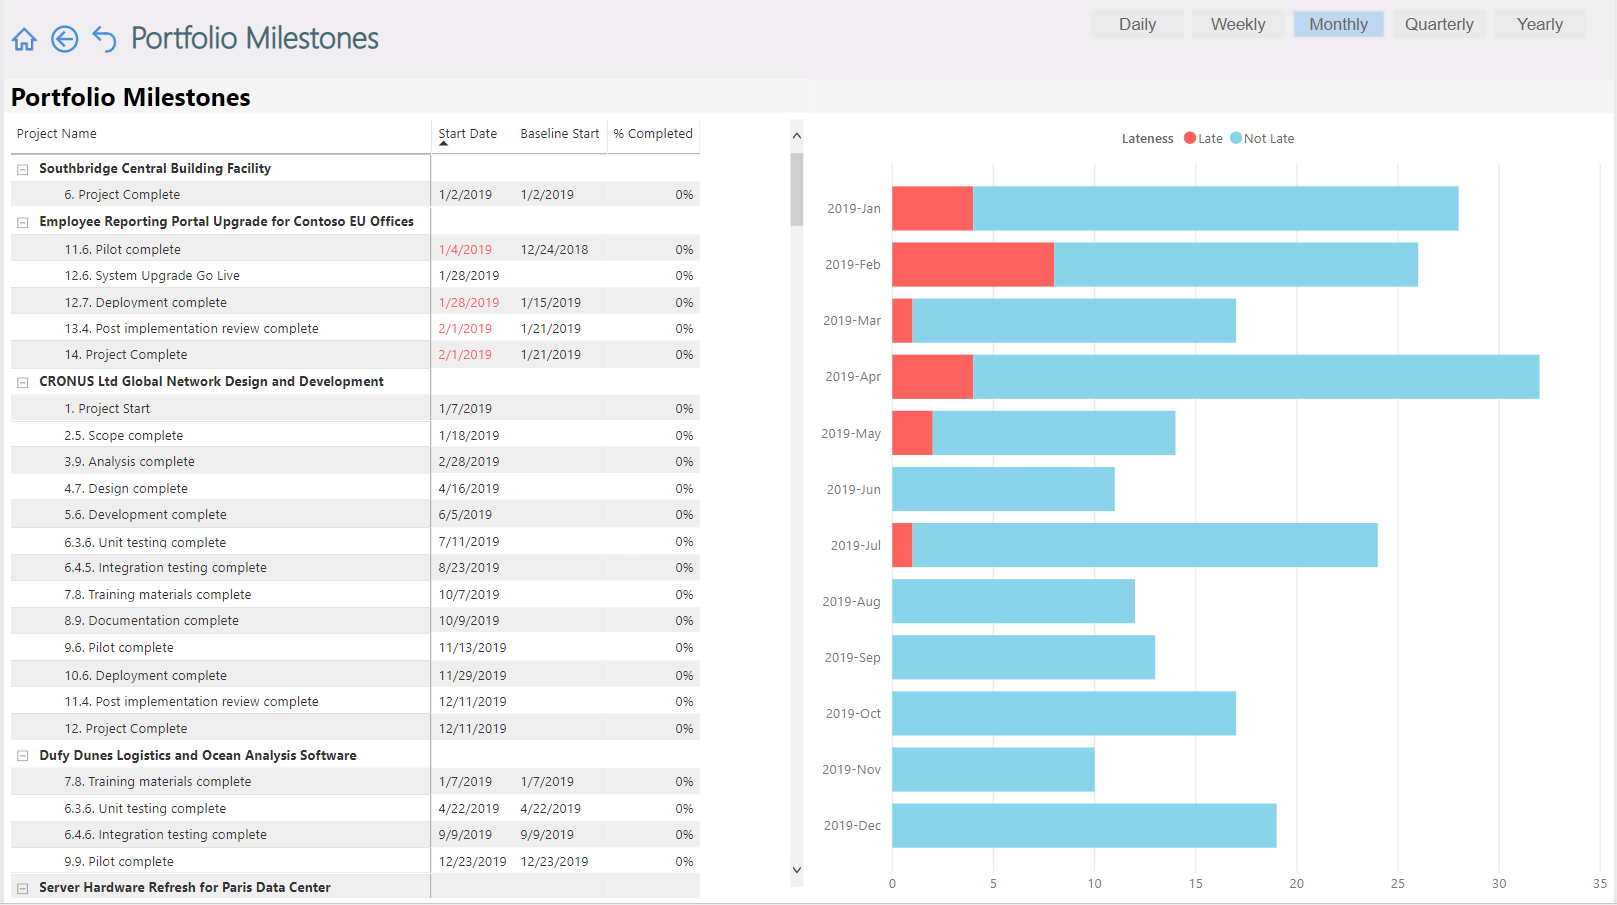
Portfolio Milestones
The Portfolio Milestones report presents information about milestones for projects in the portfolio.
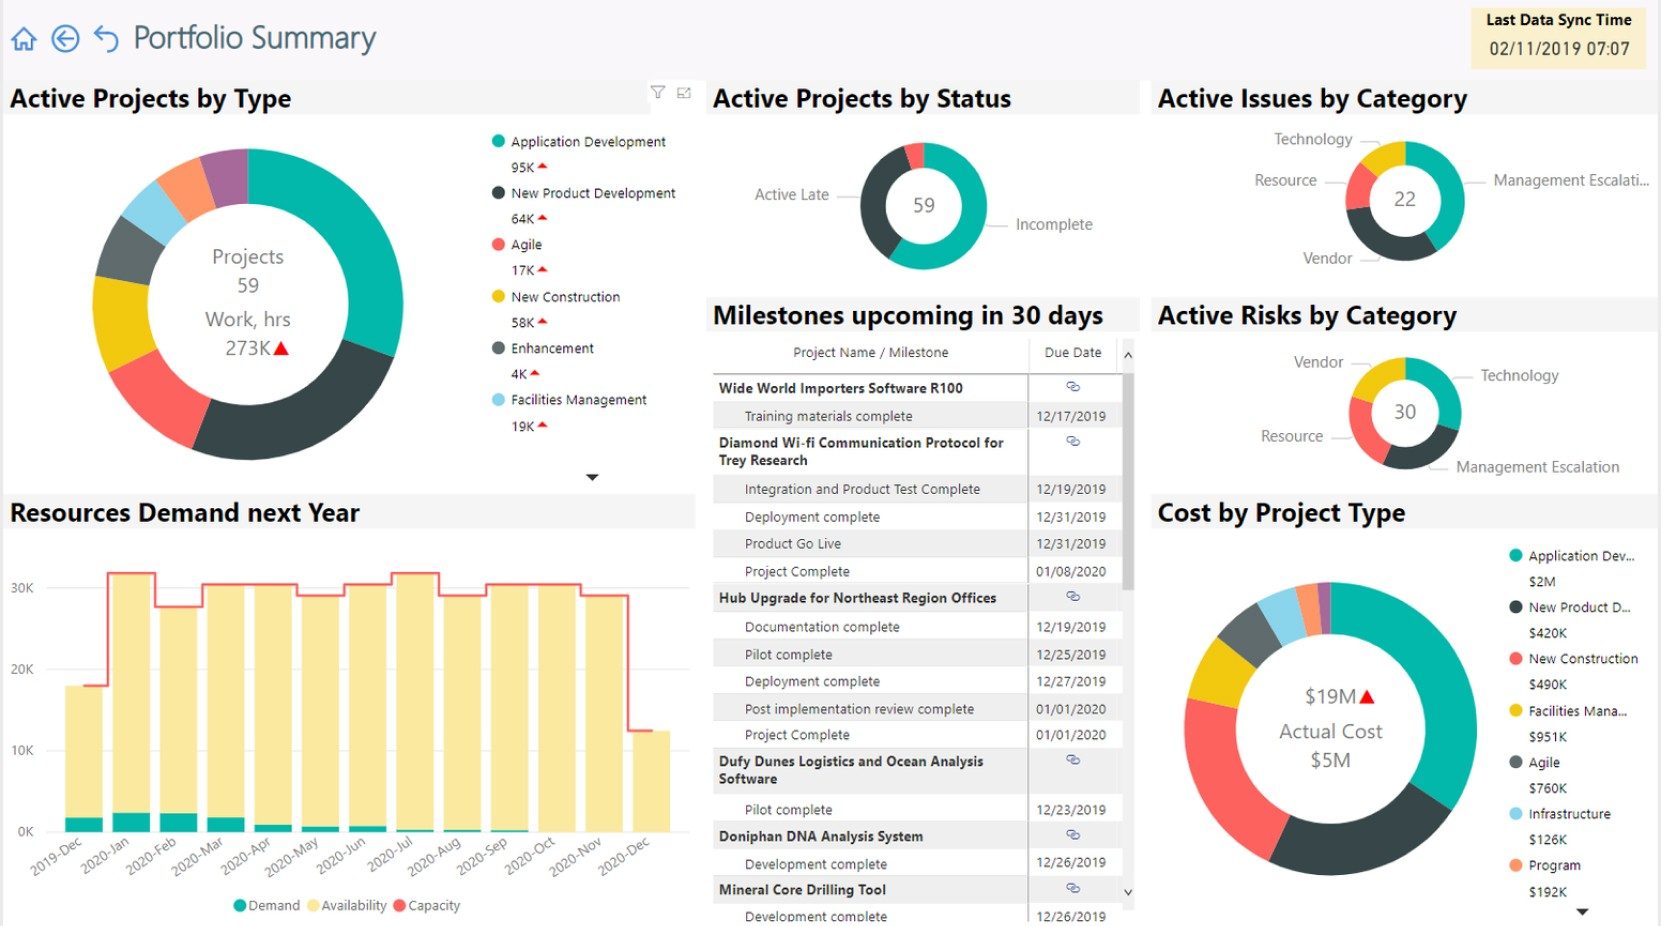
Portfolio Summary
Portfolio Summary Project Online report presents summary information about projects in a portfolio.
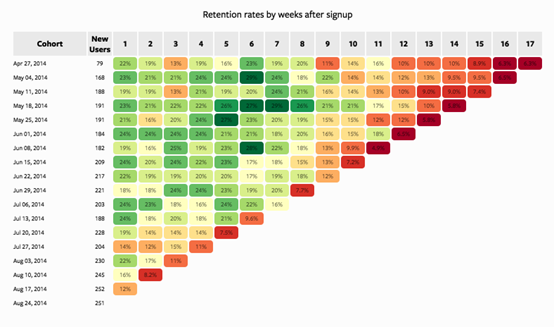
Customer Retention Analysis
This project aims to understand why customers stop buying from or cease interacting with a company.
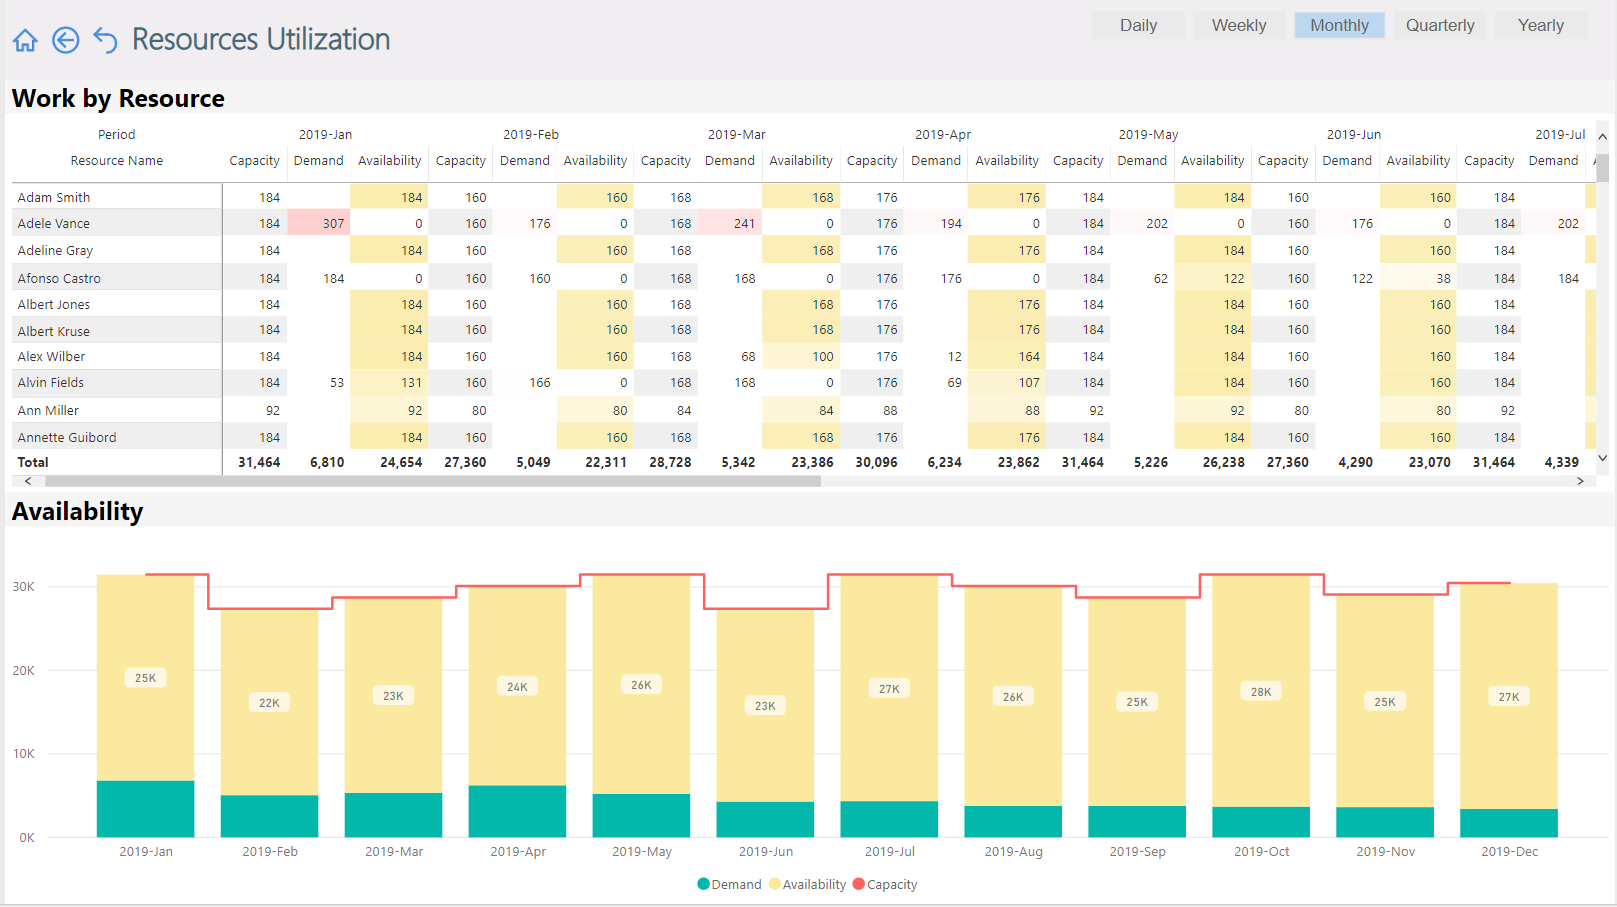
Resources Utilization
You can use Microsoft Power BI dashboards and a resources utilization report to get work information by resource and availability.
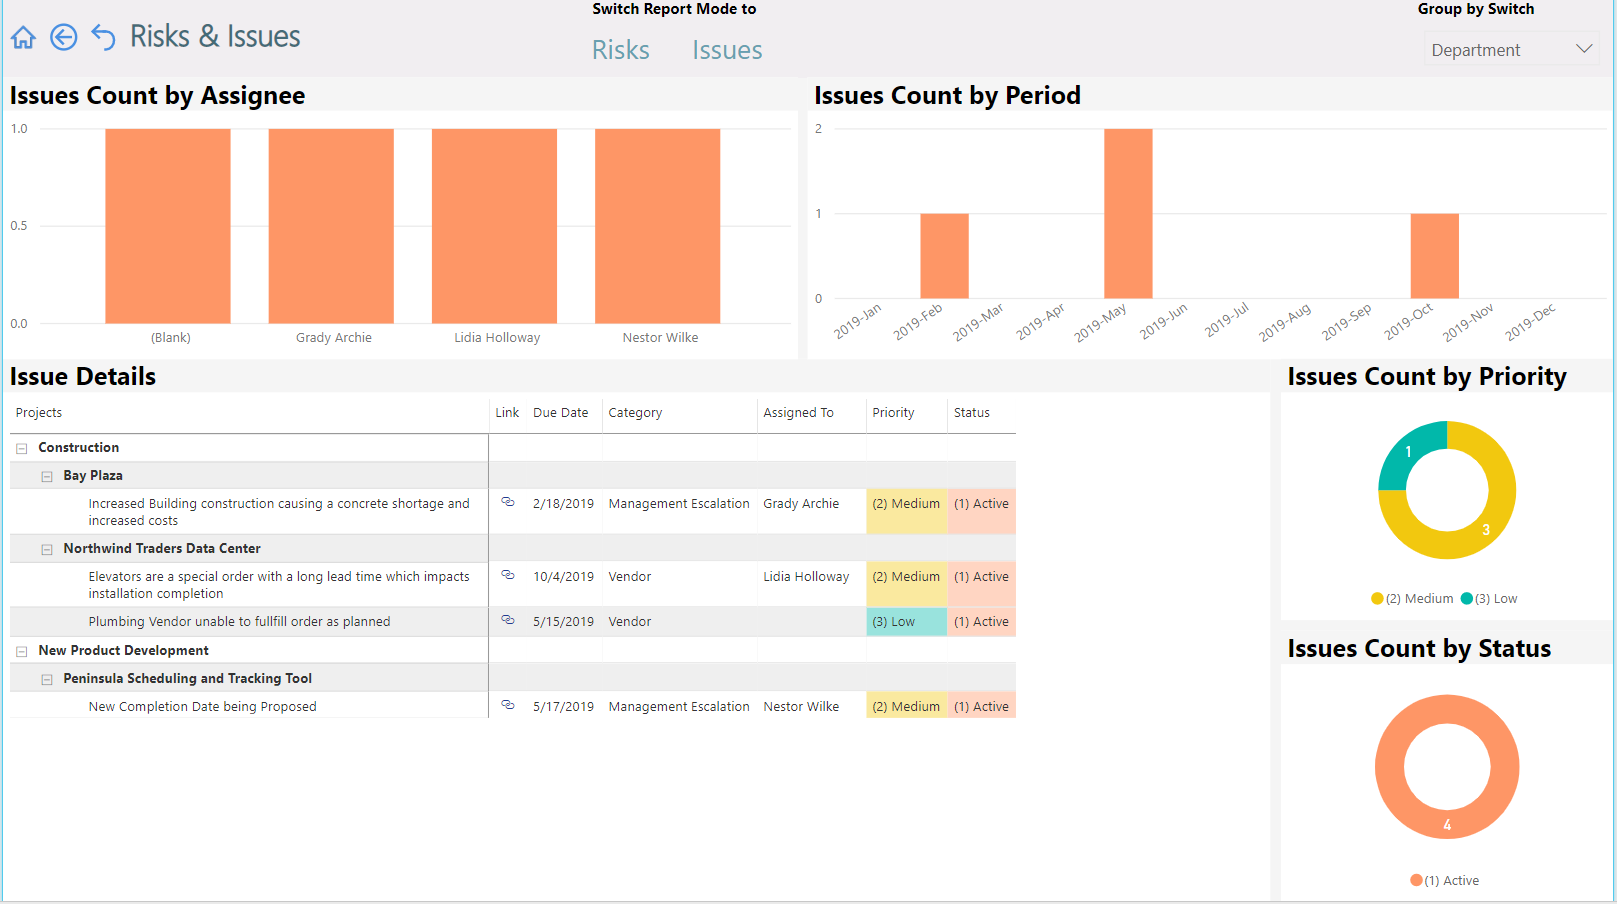
Risks and Issues
Managers can comprehensively view a project’s risk issues through the Risk Issues Report.
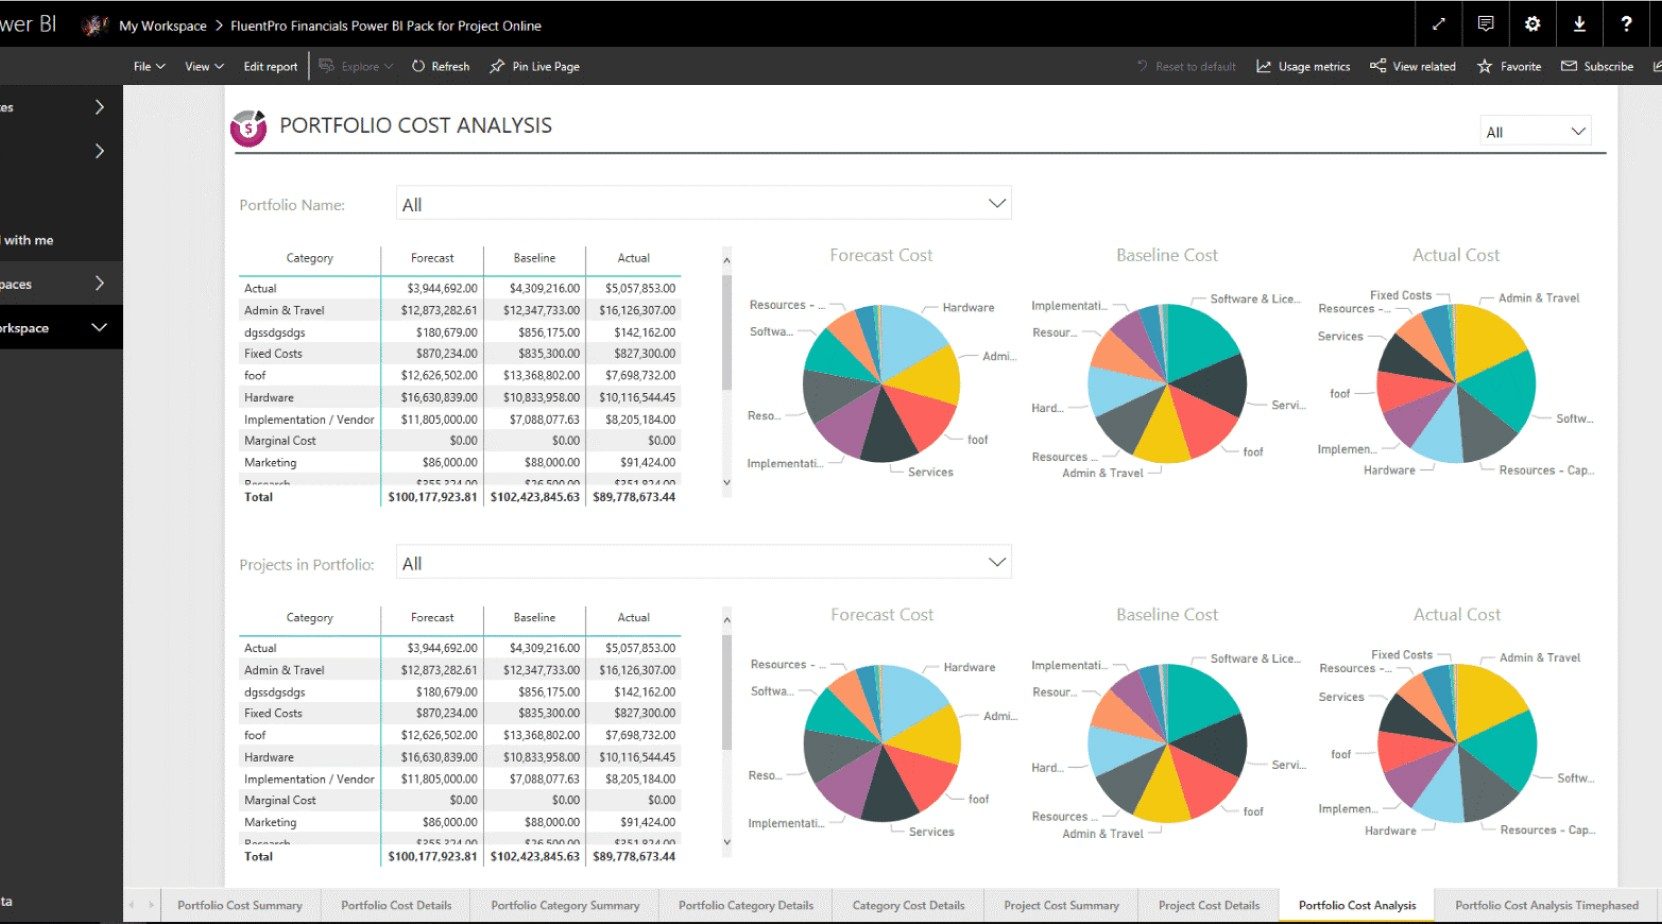
Portfolio Cost Analysis
Portfolio Cost Analysis presents a summary analysis of forecast, baseline, and actual costs by budget category for portfolios and projects in portfolios.
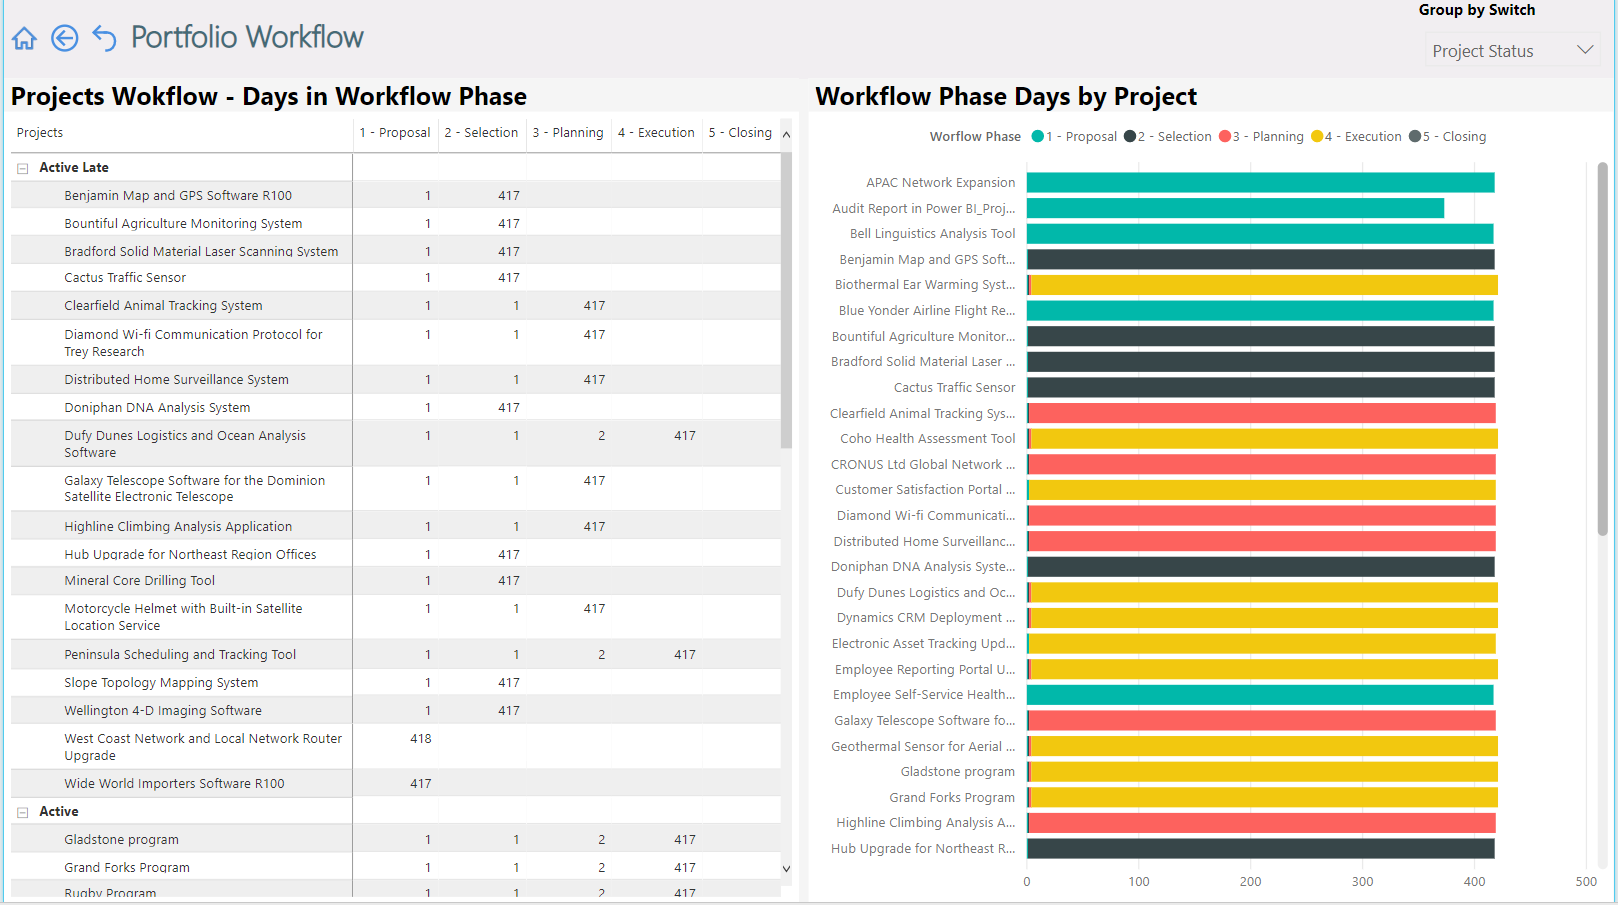
Portfolio Workflow Visualization
Microsoft Power BI Portfolio Workflow report presents Project Online workflow details for projects in portfolio.
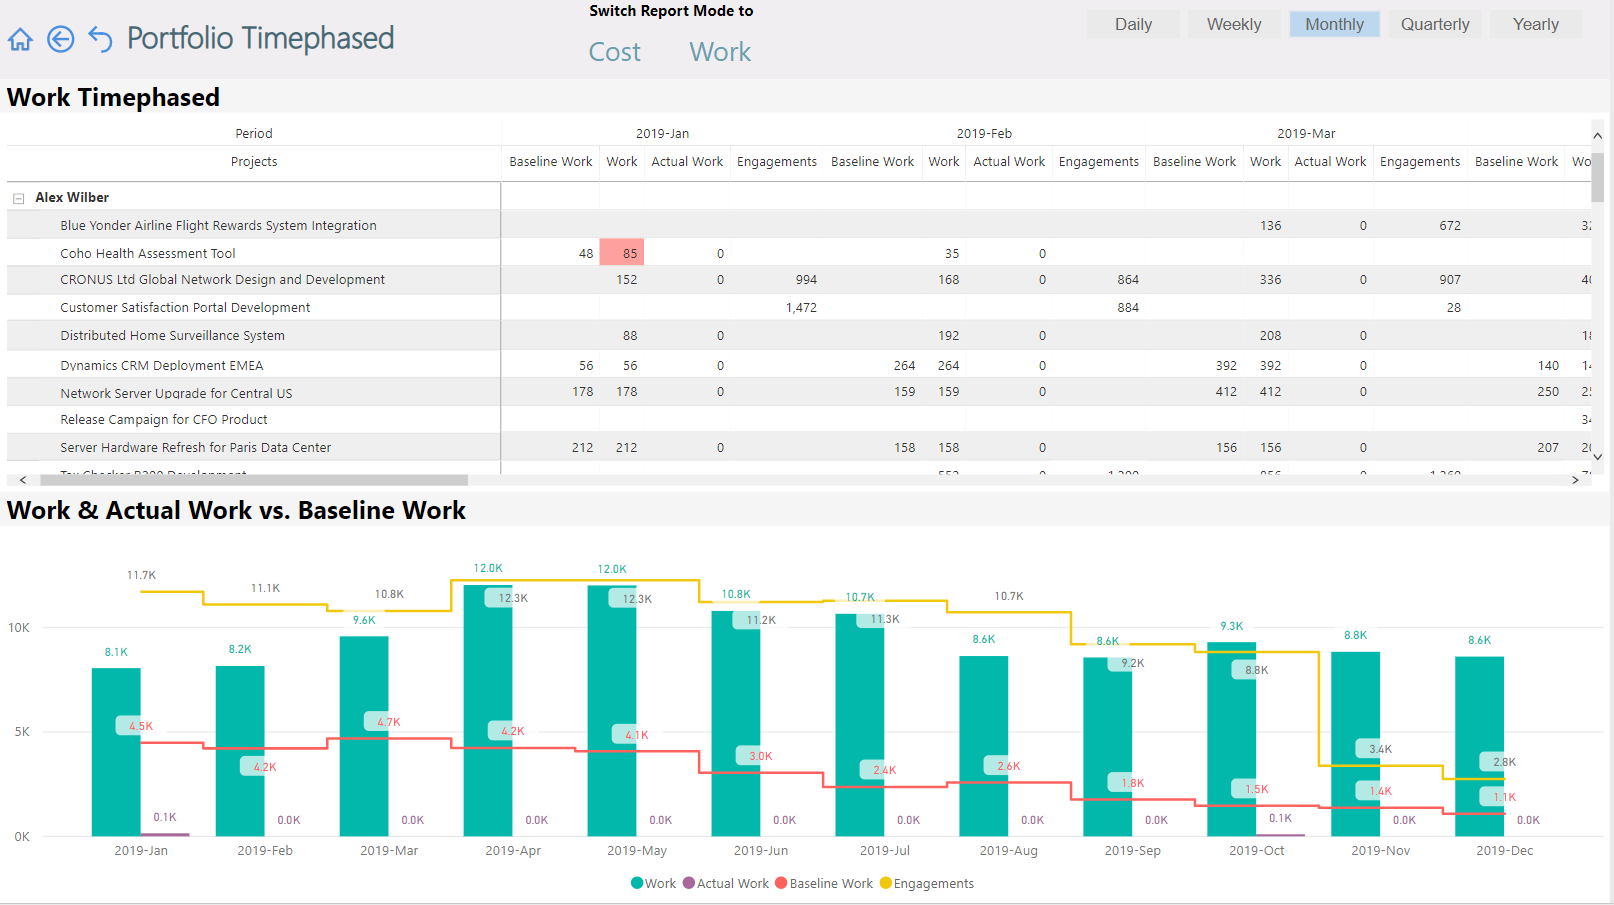
Portfolio Time-phased Report
In this project, you’ll analyze an organization’s time-phased cost & work information for projects in your portfolio. This Power BI project helps organizations improve sales, product quality, and crisis control through the analyzing tool.
Easy Implementation of Power BI Project Ideas Using FluentPro
Using Microsoft Project Online for project management needs, organizations can obtain detailed reports to track project progress, task statuses, resources, finances, etc.
FluentPro Power BI reporting pack for Project Online is a flexible and powerful reporting solution on Microsoft Project Online progress that helps you create rich visuals regardless of your skill level. It is equipped with easy-to-build reports, project visualization, and advanced analytics.
Power BI Project Online reports helps PMOs and executives with business intelligence assessment and facilitate their decision-making processes.
FluentPro Microsoft Power BI reports pack includes over 25 pre-built Power BI reports on portfolios, resources, and projects to save time. FluentPro also has 12+ years of experience in PPM solutions, so you can be sure you’ll have visually stunning projects even as a beginner. FluentPro’s accessible services and personalized approach make carrying out each project idea simple.
Conclusion
Microsoft Power BI is becoming increasingly popular in the business intelligence sector. It can easily do difficult data-intensive jobs like the project ideas we gave you. You can construct a dynamic Project Online dashboard and share that across the globe with Power BI.
Used in conjunction with FluentPro Power BI Reporting Pack for Project Online, Microsoft Power BI can significantly benefit your project. Ultimately, FluentPro services will help you quickly make rich and interactive dashboards, giving you more time to make better decisions.
Schedule a free consultation
to get help with Power BI Project Online reporting

